In the U.S., language diversity covers the map

In California, 45% of residents speak a language besides English—the highest percentage of all states. Photo by Farrel Nobel on Unsplash
by Andi Egbert, Sr. Research Associate
In the U.S., language diversity covers the map
Majority of those who speak other languages also speak English “very well”
Did you know that 17,000 Tennesseans speak Arabic? And 177,000 residents of Illinois converse in Polish?
Just as glaciers transformed our nation’s physical landscape thousands of years ago, the immigration patterns of the past three centuries—right up to the present—have left their mark on the varied linguistic patterns across the United States.
The U.S. Census Bureau released its annual language tables this fall for the population age 5 and above, but with the addition of five more languages: Bengali, Haitian, Tamil, Telugu, and Punjabi. Fascinating linguistic differences and patterns emerge for all states. Thirty-eight states have enough non-English speakers to appear in the most current snapshot using 2016 data.
While some speakers of other languages are still journeying toward English speaking proficiency, I was surprised to learn that in every one of these states, more than half of those who speak other languages also speak English “very well.” Across the United States, 60 percent of those who report speaking a language other than English at home report high proficiency in English as well.
Examining the third most common language by state that is when it really gets interesting: Navajo in Arizona, Haitian in Florida, Vietnamese in Kansas, Polish in Illinois, Arabic in Nebraska, Hmong in Wisconsin.
This multilingualism brings many advantages to those who possess it, whether from workers’ ability to better understand and connect to global markets, to appreciation for art and literature in its native idiom, to opening new pathways for social connections, and even benefits to the brain that research is increasingly underscoring.
Given the prevalence of other languages, the likelihood that your ears will encounter non-English words is highest in California, where 45 percent of residents speak a language besides English. That’s nine times the linguistic diversity that you’ll find in Kentucky or Alabama, where only five percent of residents speak another language than English.
After English, Spanish is most common language spoken in all states with 2016 data. Examining the third most common language by state that is when it really gets interesting: Navajo in Arizona, Haitian in Florida, Vietnamese in Kansas, Polish in Illinois, Arabic in Nebraska, Hmong in Wisconsin.
Here in Minnesota where the APM Research Lab is based, we have the distinction of being the only state where Somali and Amharic speakers rank so highly, due in large part to our history of resettling refugees fleeing persecution in Somalia and Ethiopia. And Chinese (including Mandarin and Cantonese) is third most common in 16 of the 38 states with 2016 data—with more than 1.2 million speakers in California alone.
Third most common language by state, 2016
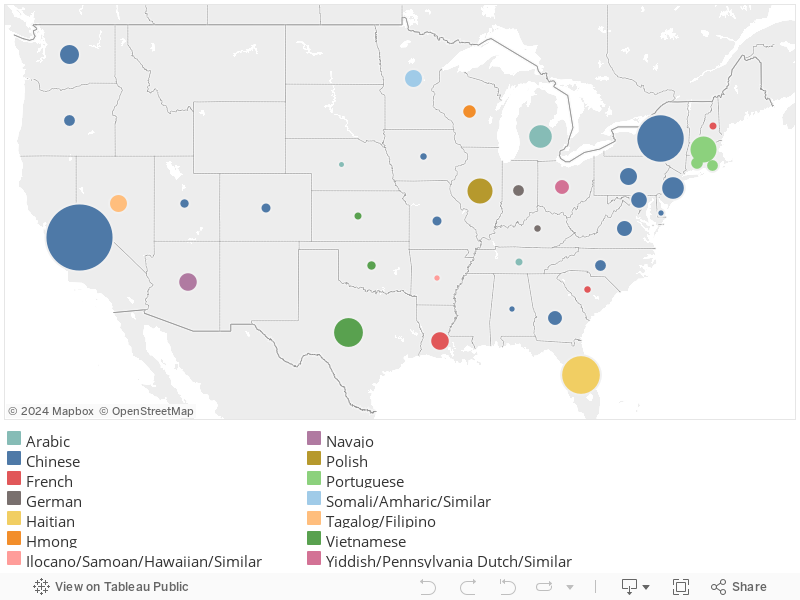
Source: U.S. Census Bureau, 2016 American Community Survey. Estimates have been rounded. Margins of error exist but are not shown.
The map above shows the third most common language (or language group) in each state appearing in the 2016 data. Hover over a state and it will also show you the number of speakers of that language as well as Spanish. Numbering nearly 40.5 million strong across the U.S., Spanish speakers make up 13 percent of the 5+ population across the nation.
-Andi (@DataANDInfo)
RELATED: Census shows Minnesota increasingly multilingual (MPRNews).
Reactions? Please email us your thoughts or respond on Twitter or Facebook.