Data Viz | Politics | Demographics
REPRESENTING US:
Voter profile tools
MORE FROM REPRESENTING US:
2018 MIDTERM ELECTION RESULTS
PRE-ELECTION CONTENT: DEMOGRAPHIC AND VOTING INSIGHT TOOLS
by ANDI EGBERT and KRISTINE LIAO | Feb. 3, 2020 | UPDATED: Nov. 17, 2020
In this fifth release of Representing US, we’ve updated our interactive Voter Profile Tools with the latest available data on the demographic and economic characteristics of the potential electorate—from education and poverty levels, to racial and immigrant make-up, and more. Utilizing new data released in September 2020 by the U.S. Census Bureau, these tools give us the most up-to-date profile of the people who decided the 2020 elections.
Despite the difficulties that came with holding an election in the middle of a pandemic, the 2020 U.S. presidential election witnessed the highest voter turnout in 120 years. As of Nov. 16, the United States Elections Project reported a 66.6% voter turnout rate among the eligible population, with a total of more than 159 million ballots counted.
Each one of these votes helped determine the outcomes of this election, including all 435 seats of the House of Representatives (although a handful remain yet uncalled), 33 races in the Senate (another two have yet to be decided), and, of course, President-elect Joe Biden. The APM Research Lab’s nonpartisan Representing US tools provide essential context for understanding these races by exploring the differences in the eligible voting populations of each state and congressional district.
Each of the six tools below represents the same data differently; change the drop-down menus to reset the views. Explore our Voter Profile Tools below or read select findings from our analysis.
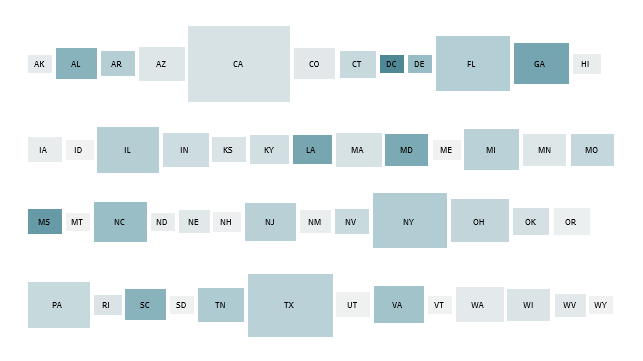
GRID SCALED BY ELECTORAL COLLEGE VOTES, ALL STATES AND WASHINGTON, D.C.
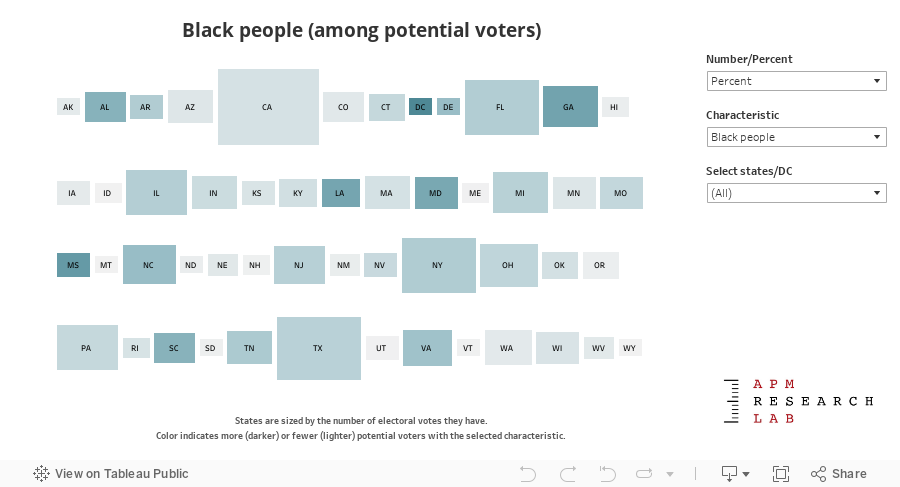
Source: APM Research Lab analysis and data visualization of the U.S. Census Bureau's 2019 American Community Survey.
Notes: "Potential voters" are defined as citizens age 18+. Some groups had too few people in the survey to create reliable estimates, and appear as no data. They should not be interpreted as zero but rather a small number.
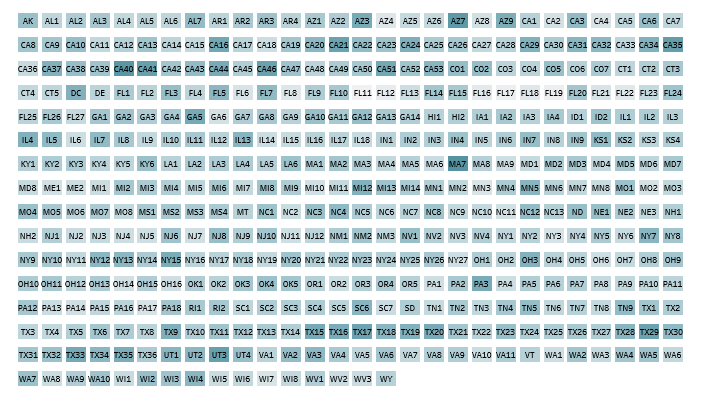
PROPORTIONAL GRID, ALL CONGRESSIONAL DISTRICTS
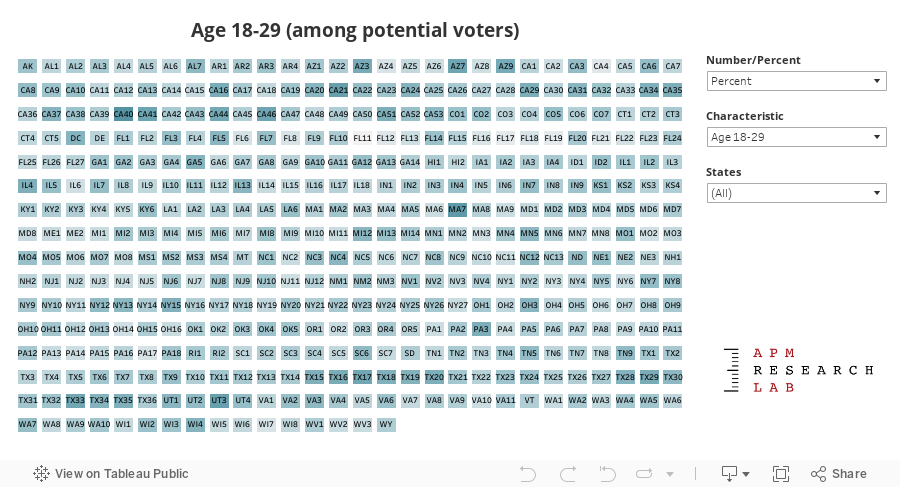
Source: APM Research Lab analysis and data visualization of the U.S. Census Bureau's 2019 American Community Survey.
Notes: "Potential voters" are defined as citizens age 18+. Some groups had too few people in the survey to create reliable estimates, and appear as no data. They should not be interpreted as zero but rather a small number.
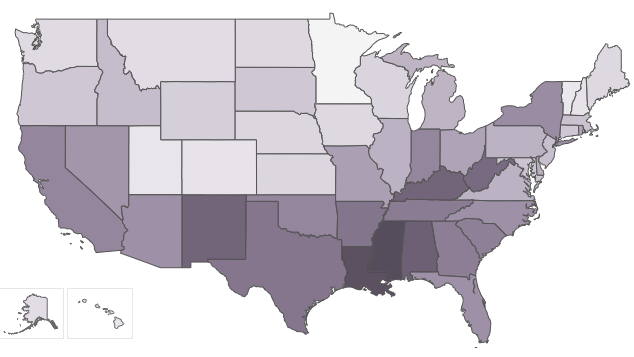
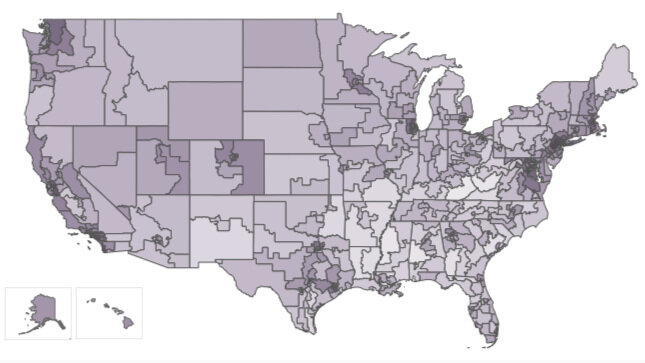
TRADITIONAL MAP, ALL STATES AND WASHINGTON, D.C.
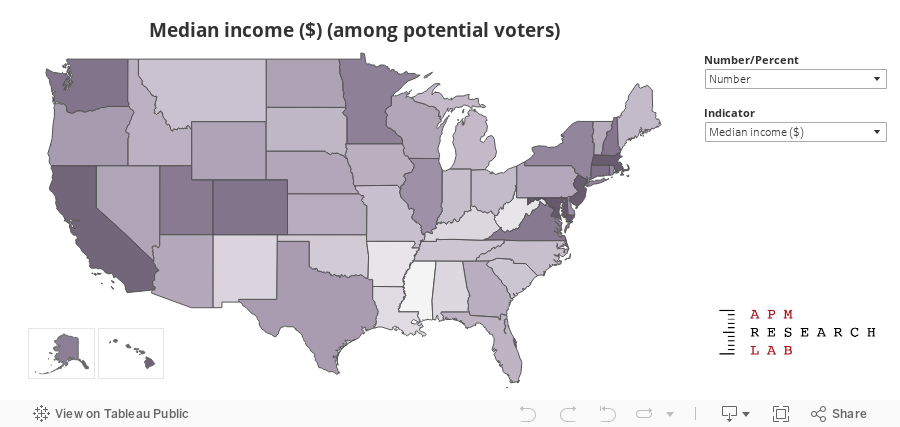
Source: APM Research Lab analysis and data visualization of the U.S. Census Bureau's 2019 American Community Survey.
Notes: "Potential voters" are defined as citizens age 18+. Some groups had too few people in the survey to create reliable estimates, and appear as no data. They should not be interpreted as zero but rather a small number.
TRADITIONAL MAP, ALL CONGRESSIONAL DISTRICTS
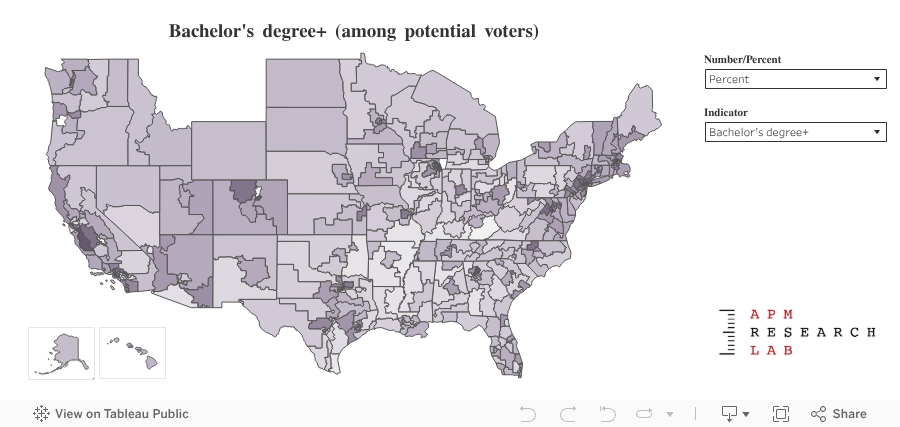
Source: APM Research Lab analysis and data visualization of the U.S. Census Bureau's 2019 American Community Survey.
Notes: "Potential voters" are defined as citizens age 18+. Some groups had too few people in the survey to create reliable estimates, and appear as no data. They should not be interpreted as zero but rather a small number.
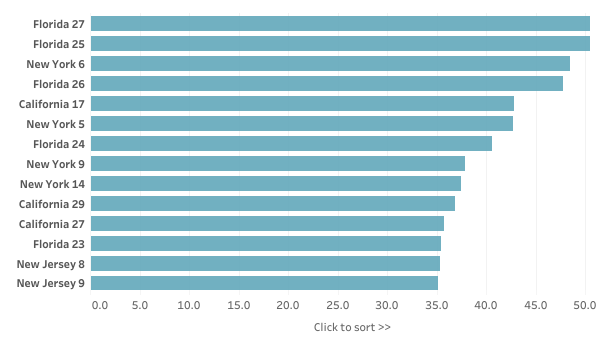
SORTING TOOL, ALL CONGRESSIONAL DISTRICTS AND STATES
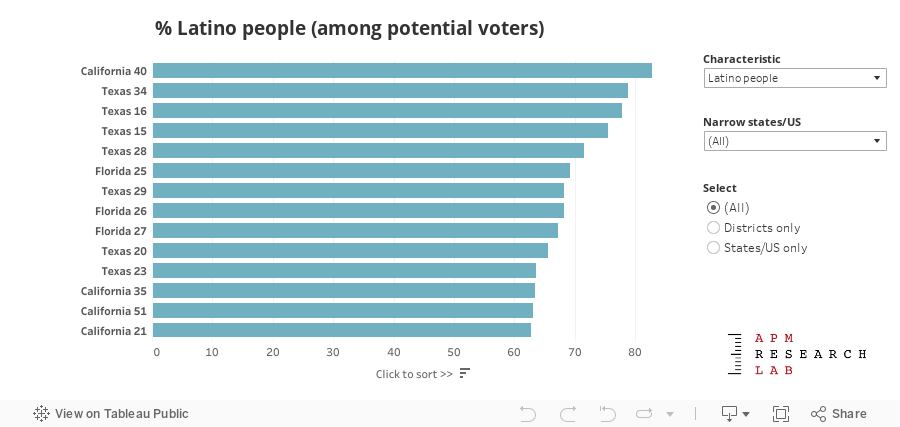
Source: APM Research Lab analysis and data visualization of the U.S. Census Bureau's 2019 American Community Survey.
Notes: "Potential voters" are defined as citizens age 18+. Some groups had too few people in the survey to create reliable estimates, and appear as no data. They should not be interpreted as zero but rather a small number.
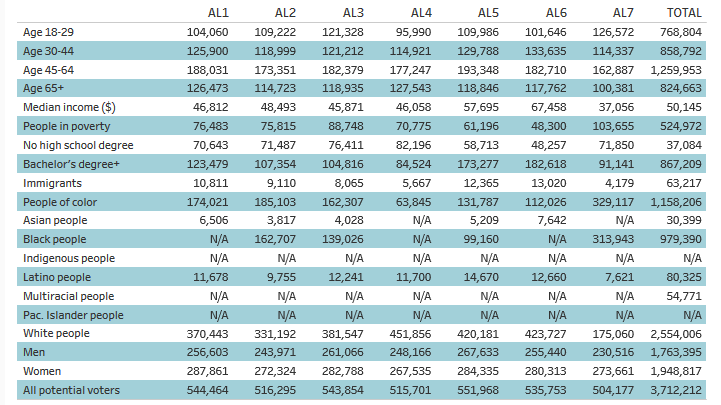
MY CONGRESSIONAL DISTRICT AND STATE TABLE
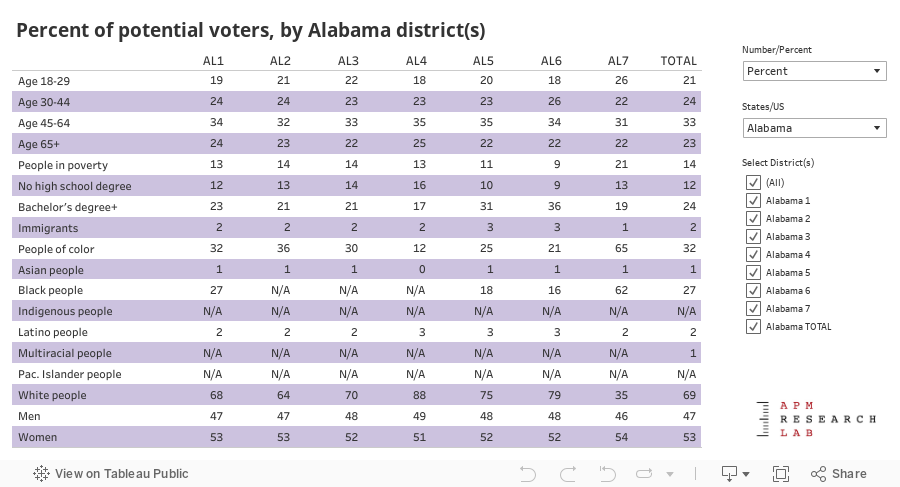
Source: APM Research Lab analysis and data visualization of the U.S. Census Bureau's 2019 American Community Survey.
Notes: "Potential voters" are defined as citizens age 18+. Some groups had too few people in the survey to create reliable estimates, and appear as N/A (not available) in this table. They should not be interpreted as zero but rather a small number.
SELECT FINDINGS FROM THE VOTER PROFILE TOOLS
These tools contain many more insights, but we’ve summarized some key findings below. Click the headings to expand and read key take-aways.
NOTES ABOUT USE OF THESE VOTER PROFILE TOOLS
On social media, please use the hashtag #RepresentingUS. You may freely use data and images from this page. Please include the following citation and link:
Source: APM Research Lab, Representing US 2020. [www.apmresearchlab.org/representingus/2020profiles].
If you wish to embed these tools, please contact us at info@apmresearchlab.org. You may view our earlier releases of Representing US tools elsewhere on our website or in our Tableau gallery.