Undercounting the poor by 4 million

Considerably more older adults live in poverty according to the Supplemental Poverty Measure than the official poverty statistics show. Photo by Matt McNulty on Unsplash
by Craig Helmstetter, Managing Partner
Undercounting the poor by 4 million
A smarter poverty metric gets at the who, where, and why of poverty
This September the U.S. Census Bureau announced that 12.7 percent of Americans, or 40.6 million of us, officially live in poverty. In the very same announcement the Bureau reported that 14.0 percent of Americans, or 44.8 million of us live in poverty. Huh?
The difference lies in the way poverty is defined: the “official” versus “supplemental” measure. The official measure has a longer history and numerous governmental assistance programs tied to it. The supplemental measure is newer and better, accounting for more forms of income and governmental assistance programs, expenses (notably health care costs) and adjusting for regional differences in cost-of-living.
So why does this difference in definitions matter? Well, if my home scale suggests that I am 10 pounds lighter than my actual weight, I might not try as hard as I should to eat right. Similarly, an imprecise measure of poverty can lead us to think that we are better or worse off than we are, and may lead us to focus our efforts at reducing poverty in the wrong places.
Indeed, the Supplemental Poverty Measure produces a different picture of who is poor in America, and where poor people live. The SPM shows:
Fewer children in poverty (15.2% versus 18.0% using the official definition)
Considerably more older adults in poverty (14.5% versus 9.3%)
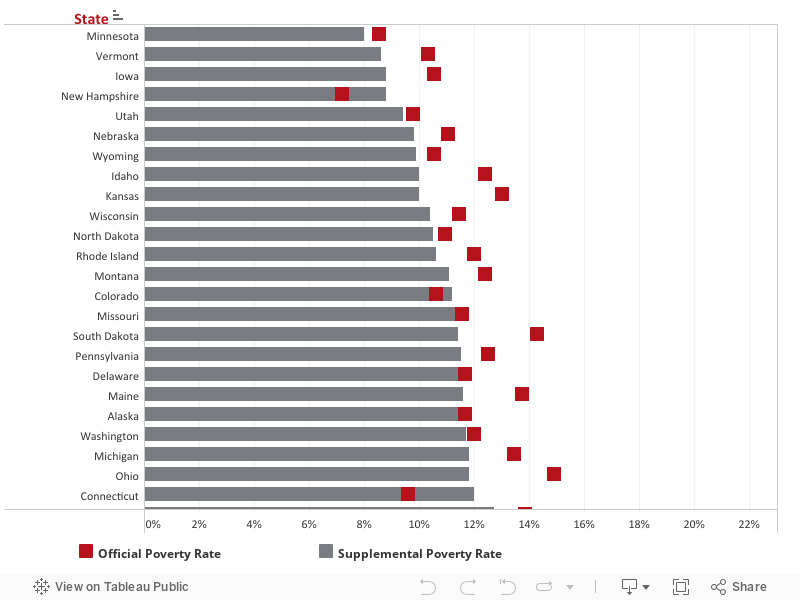
Mississippi no longer has the nation’s highest poverty rate, and states like Kentucky, New Mexico and West Virginia also have notably lower poverty rates
New York has over 500,000 more people in poverty than suggested by the official rate. Florida has an additional 700,000. California has an additional 2.3 million.
Curious how these definitions impact the picture of poverty in your state? Explore the graph, maps, and table below.
States by Official and Supplemental Poverty Rates, 2014-2016
Importantly, the Census Bureau’s analysis of the supplemental measure also shows what sorts of programs, taxes, and expenses contribute most to poverty, providing us insight into how cuts or increases to each might contribute to the issue.
Impact of Programs and Expenses on Americans in Poverty using the Supplemental Poverty Measure, 2016
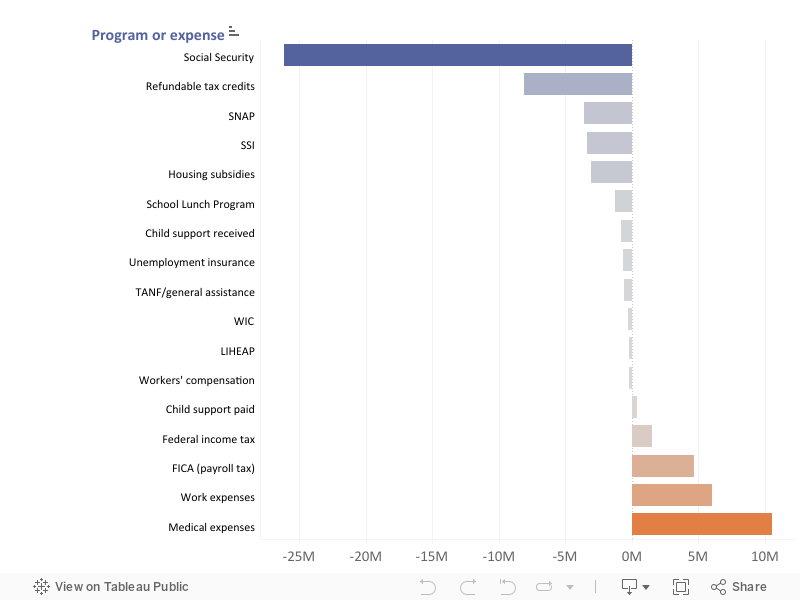
Billions of dollars in governmental assistance are allocated based on poverty rates. The official poverty rate is not a terrible measure; even an imprecise scale can tell you whether you are gaining or losing weight. However, the differences between the official measure and the improved Supplemental Poverty Measure beg the question of whether our nation’s scarce resources are currently being targeted at the right people and the right places.
Reactions? Please email us your thoughts or respond on Twitter or Facebook.