Data Viz | Politics | Demographics
REPRESENTING US

by ANDI EGBERT | Sept. 12, 2019
Our nonpartisan Representing US project is a deep exploration of the characteristics of all 435 U.S. House districts—from education and poverty levels, to racial and immigrant make-up, to congressional and presidential voting history, and more.
With this, our third release of Representing US, we’re highlighting the November 6, 2018 (and any subsequent election outcomes). All vote percentages below have been certified by states.
The 2018 midterm elections erased what was a prior 42-seat advantage for the Republicans (with seven vacancies) and handed the majority over to the Democrats. Democrats won 235 seats, including 43 formerly Republican districts. Republicans eventually claimed 199 seats, including three flipped from the Democrats. (Note: Michigan’s 3rd district was won by Justin Amash, who ran as a Republican but subsequently declared himself an Independent, the sole one in the House. Additionally, in North Carolina’s 9th district, the initial election results were thrown out due to alleged election fraud. The seat was not decided until a September 2019 special election in which the new Republican candidate, Dan Bishop, won a narrow victory over Democrat Dan McCready.)
RELATED STORIES
REPRESENTING US: The House votes to advance impeachment inquiry
REPRESENTING US: Which House members support impeachment?
REPRESENTING US: Pre-election content: Demographic tool and voting insights tool
LAB NOTES: The power of demographics in the 2018 vote
LAB NOTES: Women are running in more than half of all U.S. House races this November
LAB NOTES: The Whiter the district, the more likely it is to be represented by a Republican
LAB NOTES: Millennials eclipse Boomers as potential voters, but not everywhere
MPR NEWS: Are demographics destiny in the 5th District?
LAist: Find Out How Your Neighbors Voted Thanks To These Election Data Nerdery Tools
MPR NEWS: 5 reasons why Minnesota is a state to watch in the 2018 election
FLORIDA POLITICS: Research firm maps out Florida voter differences by congressional districts
Explore all the results in our interactive tools below.
Which U.S. House seats were held or flipped by each political party?
Where did women win U.S. House races?
How close was the U.S. House race?
How red or blue was the outcome of each race?
How strong was support for Trump in 2016, compared to the party that won the seat in 2018?
Midterms 2018: Which U.S. House seats were held or flipped by each party?
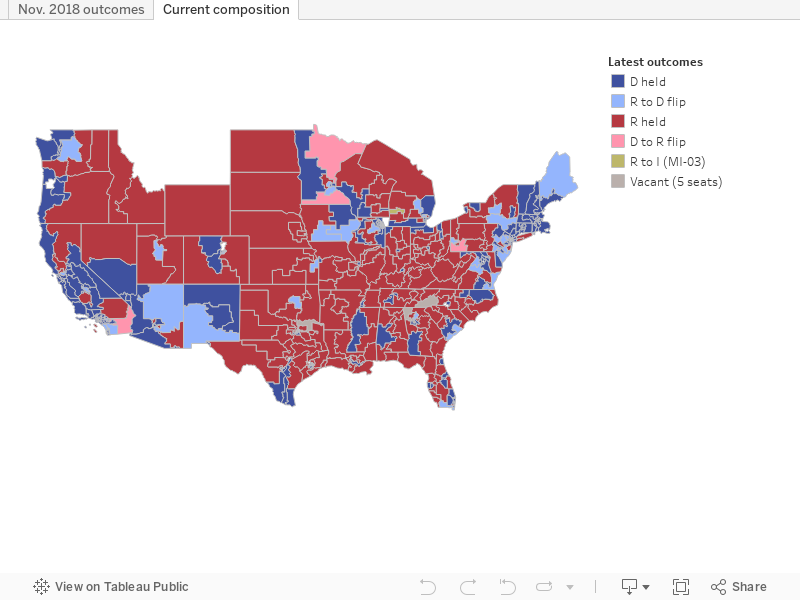
KEY FINDINGS
On November 6, 2018, Democrats held 192 seats (including five in redistricted Pennsylvania). Democrats also flipped 43 seats from Republicans (including four in Pennsylvania’s revised districts). Democrats gained the majority in the U.S. House by surpassing 218 seats.
Republicans successfully defended 197 of their seats (including eight in redistricted Pennsylvania). Republicans flipped one redrawn Pennsylvania district, along with two other districts (Minnesota’s 1st and 8th) from the Democrats. All told, Republicans won 199 seats in the 2018 midterms. In July 2019, Republicans lost a seat when Rep. Justin Amash (Michigan’s 3rd District) declared himself an independent. However, the Republicans raised their tally back to 199 seats after North Carolina’s 9th District—where initial results were thrown out—was eventually decided in a September 2019 special election.
Currently, there are five vacancies in the House: in California’s 50th district, Georgia’s 5th and 14th districts, North Carolina’s 11th district and Texas’ 4th district.
Midterms 2018: Where did women win U.S. House races?
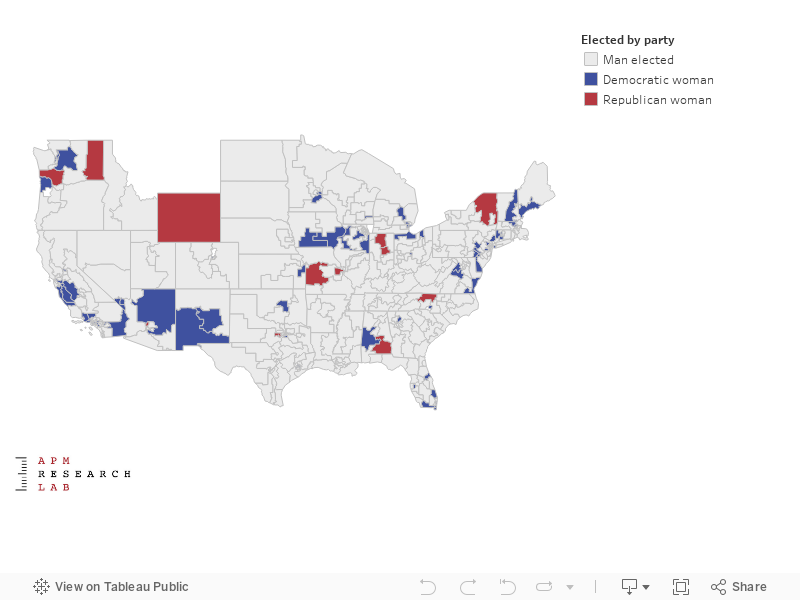
KEY FINDINGS
Following the historic midterm election, a record-setting 102 congresswomen were seated in the 116th Congress’ House of Representatives.
Thirteen Republican women won a seat in the U.S. House of Representatives, resulting in a victory for 25 percent of all Republican women running. Additionally, 89 Democratic women won their congressional district races, or 48 percent all Democratic women running.
Rep. Katie Hill (D) resigned her seat representing California’s 25th District in October 2019. Mike Garcia (R) won the May 2020 special election to fill the seat, resulting in one less woman in the House (in addition to a flipped seat for Republicans).
Midterms 2018: How close was the U.S. House race?
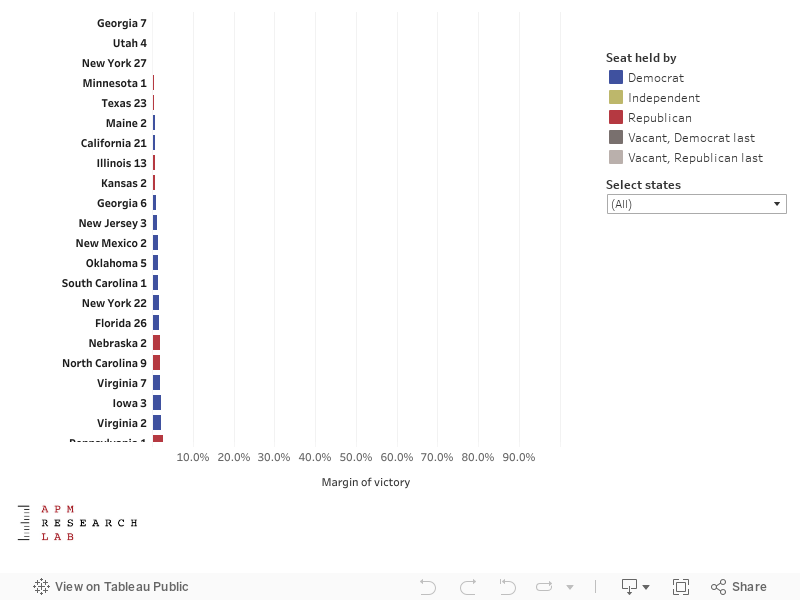
The smallest margins of victory in the 2018 midterm elections were in Georgia’s 7th District (in which Republican incumbent Rob Woodall narrowly defeated Democrat Carolyn Bordeaux) and Utah’s 4th District (where Democrat Ben McAdams unseated Republican incumbent Mia Love). In both, 0.2 percentage points separated the candidates after all votes were counted.
Compared to 28 uncontested House races in the 2016 election, 2018 saw 18 House races that were uncontested. Only two of the 18 were Republican-held; Democrats were assured a victory in the 16 other unchallenged seats. One of the Republican seats that was uncontested in November 2018, North Carolina’s 3rd District, had an unsuccessful Democratic challenger in a subsequent September 2019 special election. In that race, Greg Murphy (R) defeated Allen Thomas (D) by 24 points to win the seat previously held by Walter Jones (R), who died in office in February 2019.
Midterms 2018: How red or blue was the outcome?
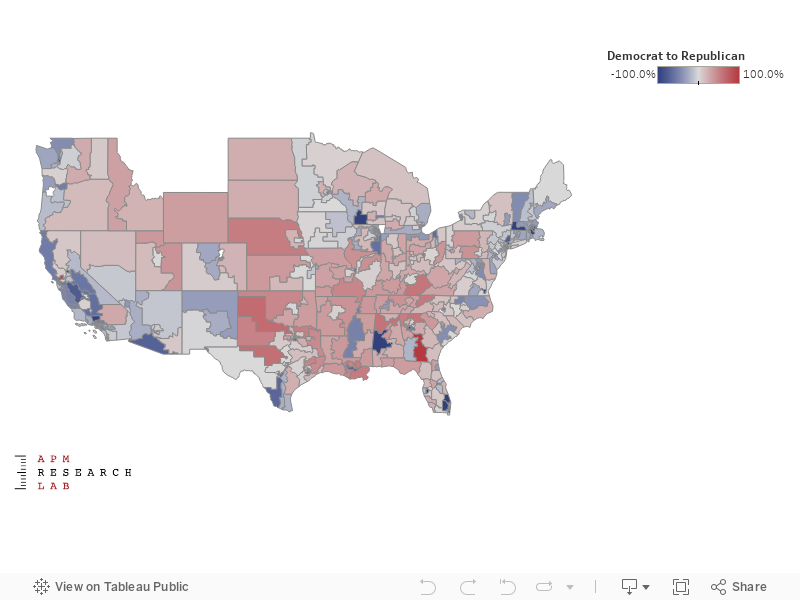
KEY FINDINGS
There were 47 House races that were won by five percentage points or less, including seven races in Texas, five races in California, three races in New York, three in redistricted Pennsylvania.
In addition, the North Carolina’s 9th District seat—the last midterm race to be decided—was won by 2 percentage points in a special election roughly 10 months after the midterms were held. Republican Dan Bishop prevailed over Democrat Dan McCready on Sept. 10, 2019. NC-09’s initial 2018 vote tally between Dan McCready (D) and Mark Harris (R) was thrown out due to election fraud. Harris subsequently dropped out of the race. Dan Bishop won the new Republican primary election on May 14, 2019 to face McCready.
Midterms 2018: How strong was support for Trump in 2016, compared to the party that won the seat in 2018?
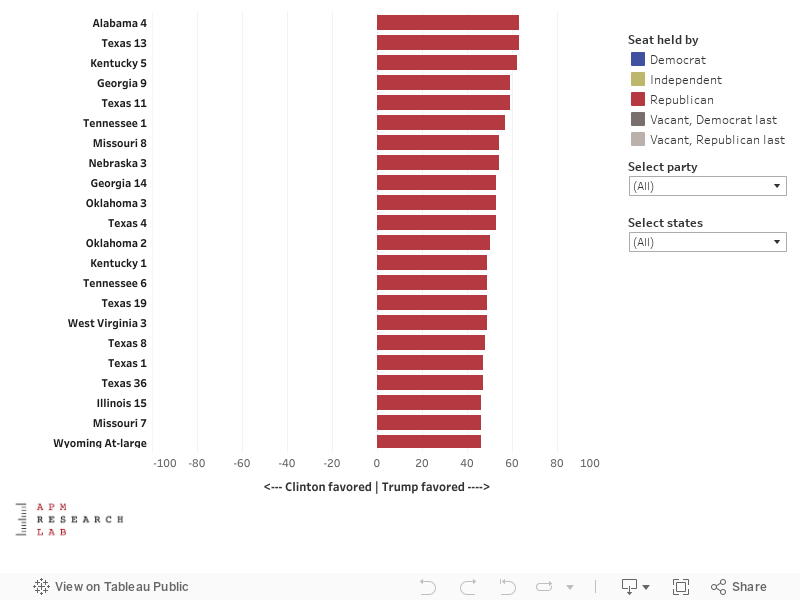
KEY FINDINGS
Thirty-three U.S. House districts that voted in greater numbers for President Trump over Hillary Clinton in 2016 also sent a Democrat to Congress in 2018. (This count includes Pennsylvania’s new 6th, 7th, 8th, and 17th Districts, which were compared to their most comparable district in 2016, prior to redistricting. See bit.ly/PAredistricting for more details). Most notable was Minnesota’s 7th District, in which voters sent longstanding Democratic Representative Collin Peterson back to Congress by a four-point margin, despite favoring President Trump by 31 percentage points two years earlier.
Only two districts that favored Clinton over Trump in 2016 sent a Republican to the U.S. House in 2018: New York’s 24th and Texas’ 23rd district. Republican incumbents John Katko and Will Hurd won by 5.2 and 0.5 percentage points, respectively, in those districts. Each district had preferred Trump to Clinton by a margin of four percentage points in 2016.
Notes about use
On social media, please use the hashtag #RepresentingUS. Users may freely use data and images from this page. Please include the following citation and link. Source: APM Research Lab, “Representing US, 2019.” Available at: apmresearchlab.org/representingus.
You may also wish to see our second release of our Representing US tools (pre-election content including candidate data and demographic and economic data by district) or our first release of Representing US tools in our Tableau gallery. Please email us at info@apmresearchlab.org with any additional questions about these tools.
How to navigate these tools
On map views, use + or – (in toolbar along the left side of any map view) or your mouse scroll wheel to zoom in and out. You may also click the magnifying glass icon and enter a location to zoom to it. Use the cross-shaped tool to pan and move about, including locating data for Hawaii or Alaska.
Click the home icon or refresh your browser page to reset the view. All bar graphs and tables may be sorted (high-to-low, low-to-high, or alphabetically) by clicking the sort icon (three stacked bars).
Click here if you do not know your U.S. House district to locate it by your zip code, or use the magnifying glass icon on the map views to identify district(s) associated with a zip code, city, state, or other geography.
Data sources and notes
The 2018 election results were sourced from the New York Times ’ 2018 coverage. (D) refers to Democrat, (R) refers to Republican, (I) refers to independent, (L) refers to Libertarian, and (G) refers to the Green party.
In the case of formerly vacant U.S. House seats, the party which last held the seat is used to determine who held or flipped the seat for the map titled “Which U.S. House seats were held or flipped by each party?”
Uncontested 2018 races as well as same-party races (e.g., Democrat vs. Democrats) are represented as 100% blue or red in the “How close was the U.S. House race?” bar graph and the “How red or blue was the outcome of 2018 midterm election?” map. In the case of a Democrat or Republican defeating a third party candidate, the respective margin of victory is shown as a percentage red or blue in the latter map.
Data on Trump/Clinton margin in 2016 by U.S. House district sourced from Cook Political Report’s Partisan Voting Index by state and district, which uses data collected by POLIDATA. Further methodology can be found in the full Report by Cook. Data on 2016 U.S. House election results (and subsequent special elections) sourced from CNN, Politico, the New York Times, and states’ Secretary of State offices.
In some cases, margins of victory may differ slightly from the gap between candidates’ vote shares, due to rounding from figures with greater precision.