Against a backdrop of fewer babies, Utah leads the nation in birth rates

Utah’s nation-leading birth rate helped it lay claim to the title of 3rd fastest growing state in 2017.
by Andi Egbert, Sr. Research Associate
Against a backdrop of fewer babies, Utah leads the nation in birth rates
Five questions and answers about natural change for states
Natural change sounds like a phrase you’d use to describe the turning of the seasons. But in a demographic context, natural change refers to the answer to a basic population equation: births minus deaths. Natural increase indicates when the number of new babies outnumbers residents who have passed on, and natural decrease, the opposite.
Along with domestic migration and international migration, natural change is one of three basic drivers of an area’s population change. As such, it impacts everything from the size of the future labor force and economic growth to taxes and traffic.
So where are the cutest, littlest residents making the biggest impact in population tallies? Of the 42 states who saw population growth in 2017, more than half of them (23) have natural increase—not migration—to thank for the majority of their growth. And for the eight states that lost population, seven saw natural increase soften population losses from net out-migration.
Exploring natural change for states each year of the decade
On mobile, view horizontally.
Source: U.S. Census Bureau, Vintage 2017 Population Estimates.
Here are five questions and answers about natural change for states, from the latest data:
Which states had the greatest natural increase in 2017?
In order, the youthful states of California (+214,000), Texas (+210,000), and New York (+73,000) led the nation in natural increase in the latest year. Georgia, Illinois, Utah, Virginia, Washington, North Carolina, and Colorado also saw between 30-50 thousand more births than deaths each.
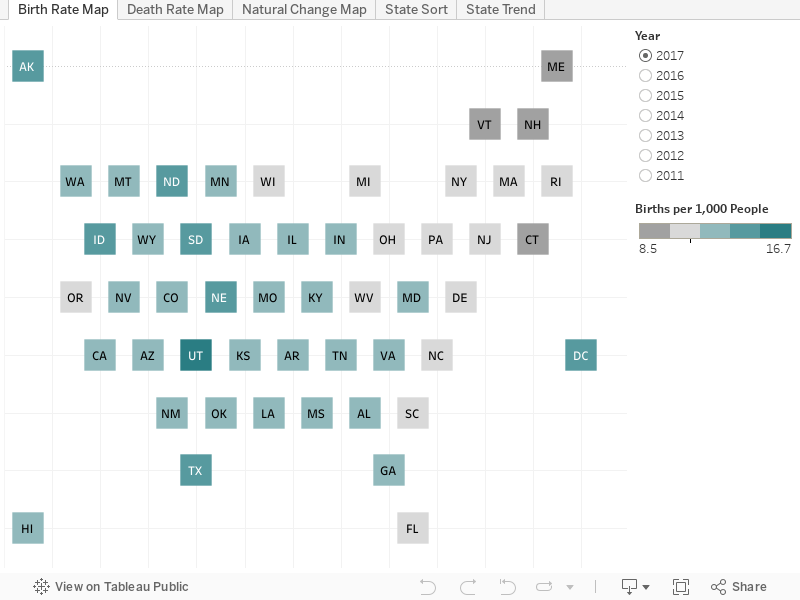
As a rate, where are the babies booming?
In Utah, where the arrival of nearly 17 babies per each 1,000 residents in 2017 means diaper sales must be brisk. Utah’s nation-leading birth rate helped it lay claim to the title of 3rd fastest growing state in 2017. (Idaho and Nevada, the two faster growing states in 2017, owe more of their growth to migration than natural increase). Alaska, Texas, and North and South Dakota round out the top five states for birth rates, and Washington, D.C.’s rate falls inside this pack as well.
Conversely, New Hampshire, Vermont, Maine, Connecticut, and Rhode Island are the states where you were least likely to encounter new babies relative to the overall population.
Which states experienced natural decrease in 2017?
West Virginia and Maine are the only two states where deaths outnumbered births in 2017. While this is not a new development for West Virginia, its natural decrease of -3,100 proved the largest loss it has seen any year of this decade.
Maine saw 1,200 deaths over and above births in the latest year, resulting in the fifth consecutive year in a row of its negative natural change.
In nine other states, natural increase tallied less than 5,000 in 2017. In general Midwestern and Northeastern states are the ones where deaths just slightly lag births—resulting in very little potential for population growth outside of migration. (Explore domestic and international migration trends in my earlier blogs)
Where are death rates highest across the U.S.?
Eight states saw death rates of 10 or more deaths occurring per 1,000 residents in 2017, with West Virginia receiving the painful distinction of being “top” state in this regard—with 12.2 lives lost per 1,000 West Virginians.
The other states with the highest mortality rates include Alabama, Mississippi, Maine, Pennsylvania, Arkansas, Kentucky, Oklahoma, Ohio, and Tennessee. Note that these death rates are not age-standardized—so they pick up the differences in the age distribution of the actual population. “Grayer” states will necessarily have higher levels of mortality. This decade, so-called “deaths of despair,” including lives lost to opioids have accelerated death rates in places all across the country.
What is the outlook for natural change in the U.S.?
While it might not seem like it when multiple infants are crying on your airplane ride, having babies is becoming a rarer phenomenon. Although there are several ways to measure the fertility rate, the number of births for every 1,000 U.S. women of childbearing age hit an all-time low in 2016, at 62.
As the outsized Baby Boomer generation (whose members today are 54- to 72-years-old) continue to age into the last decades of their lives, mortality rates across the U.S. will climb considerably. Shortly, more states will join in West Virginia and Maine in experiencing natural decrease.
Natural change is projected to fall to less than one-third of today’s level in the United States by 2050, but remain positive. Many countries in Europe are not so lucky. Concerns about creating an adequate future labor force to support the older population have lead some countries to try to encourage childbearing. Here’s how well that went over in Italy.
This is the third article in a series about components of population change, based on the Census Bureau’s 2017 Population Estimates for states. Please also see the related articles on domestic migration and international migration.
Reactions? Please email us your thoughts or join the conversation on Twitter or Facebook.