Destination U.S.: Five facts about states' international migrants in 2017

In Florida, Massachusetts, New York, and New Jersey, more than 6 out of each 1,000 state residents were new arrivals from abroad in 2017.
Photo: CDC Global via Flickr
by Andi Egbert, Sr. Research Associate
Destination U.S.
Five facts about states’ international migrants in 2017
Each year when the Census Bureau publishes its best estimate of each state’s total number of residents, it also includes data about what’s driving those population tallies higher or lower—including births, deaths, domestic migration, and international migration.
International migration is the most variable part of this equation for population change--as federal immigration policies and procedures, changing global economic conditions, and numerous other causes can dramatically change the flows of people into (and out of) the United States. For example, 2017 saw refugee admissions sharply curtailed by the Trump Administration and a rare drop in foreign students studying at U.S. universities.
These data on “international migrants” are broader than just permanent immigrants. They reflect the net movement of all people between America and other countries, including U.S. territories like Puerto Rico. This includes green card holders, refugees, various time-limited visa holders including students and specialty workers, as well as those without legal status to enter the country. A small share are U.S. citizens leaving for or returning from stays in other countries—including members of the military.
In 2017, 1.11 million net international migrants entered the U.S., about 21,000 fewer than in 2016 and 13,500 fewer than 2015, but more than all other years since 2010.
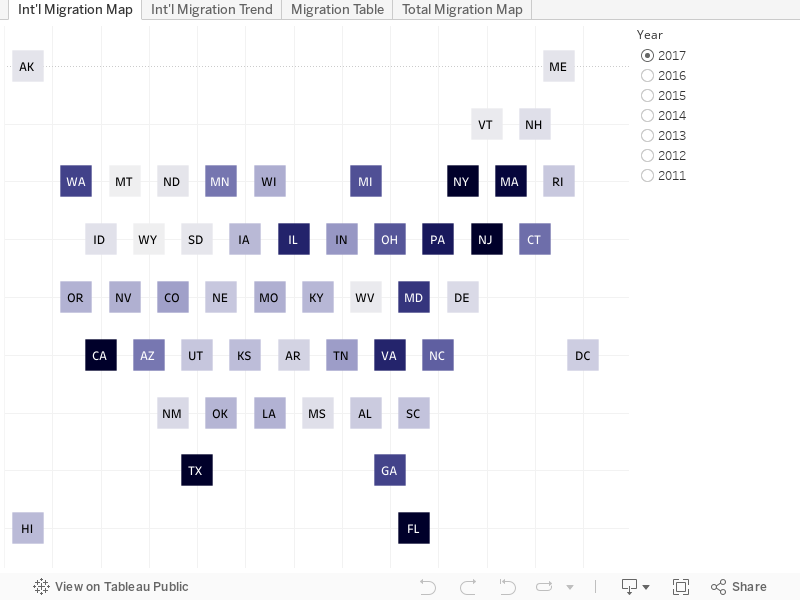
Jump to the bottom of this page to explore the data viz showing how international migration has changed each year of this decade for all 50 states.
Here are five facts on international migration for states in 2017:
Front-runner California gained 165,000 new international arrivals in 2017, ahead of Florida (+144,000), New York (+130,000), and Texas (+110,000). That these four states netted the most international migrants is unsurprising, considering they are most populous. But these destination states welcomed more than one might expect: Collectively they received roughly half of all international migrants who entered the U.S. in 2017, despite jointly representing a third of the U.S. total population.
Although they are among the top four states for international migration gains, curiously New York and California are also the top two states for domestic migration losses (-191,000 and -138,000, respectively), as former state residents picked new states to call home. Considering both domestic and international flows, the total picture of migration is still a net positive for California (resulting in 27,000 net new residents) in 2017, but net negative for New York (where all migration ultimately trimmed about 60,000 people from its population).
In 30 states, net international arrivals numbered less than 10,000 in 2017, and in 18 states, less than 5,000. At only 300 international migrants gained apiece, Montana and Wyoming were the least likely destinations for international migrants, followed by Vermont and West Virginia (900 apiece).
International migrants were down in every state in 2017 compared to 2016. Some states—Maine, Minnesota, Oregon, South Dakota, Vermont, West Virginia and Wisconsin among them—saw nearly identical estimates of international migrants during the past two years. Another pack of 11 states including Arkansas, Connecticut, Delaware, Idaho, Indiana, Iowa, Montana, Nebraska, New Hampshire, Rhode Island, and Utah were down by only about 100 people from 2016. While the declines were not especially dramatic in 2017, this still marked a reversal of otherwise climbing international migration gains throughout the decade, for nearly all states.
In Florida, Massachusetts, New York, and New Jersey, more than 6 out of 1,000 state residents were new arrivals from abroad in 2017. These four states and the District of Columbia saw the fastest growth from international arrivals in 2017, considering their population size.
The data viz below shows which states have the greatest numbers of international arrivals (in darkest blue) during each year this decade. In addition to the international migrant tally, hover over any state to see additional figures for domestic (state-to-state) migration, and how the addition of natural change (births minus deaths) results in overall population growth or decline. Click the tabs for additional views of these migration data.
On mobile, view horizontally.
Source: Vintage 2017 Population Estimates from the U.S. Census Bureau. Data have been rounded to the nearest 100.
Reactions? Please email us your thoughts or join the conversation on Twitter or Facebook.