Migration magnetism: Five facts about 2017 state-to-state population movement

Among young adults age 18-24, more than 5 out of 100 hopped state lines in the latest year of data. Among 25- to 34-year-olds, the rate falls slightly to 4 out of every 100. No other age group comes close to this level of wanderlust.
by Andi Egbert, Sr. Research Associate
Migration magnetism
Five facts about 2017 state-to-state population movement
The flows of people across state boundaries—domestic migration—is of particular interest to a host of people: businesses feeling the pain of labor shortages, housing developers and transportation planners, Census 2020 watchers wondering how Congressional seats will be reallocated, and even those for whom it’s a point of state pride.
Some patterns of domestic migration are more durable—like long-favored states and young adults’ penchant for border-hopping—while other drivers of change, such as volatile economic conditions or natural disasters, are harder to foretell. Potential impacts from the devastating 2017 summer and fall hurricane season are not yet captured in these data, as they track mid-year changes. Scroll to the bottom of this page to explore a data viz showing how domestic migration has changed each year of this decade for all 50 states.
Here are five facts about domestic migration from the latest data through 2017.
Netting 161,000 new residents from other states, Florida was the domestic migration champ in 2017. (And in 2016 and 2015.) Second-place Texas, with fewer than half as many domestic migrants (79,000), had led the nation in state-to-state migration for the first part of the decade. Next in line, North Carolina and Washington each acquired about 65,000 transplants in 2017, with Arizona just behind.
New York (-191,000 domestic migrants), California (-138,000), and Illinois (-115,000) experienced the largest declines in 2017 due to former residents now favoring other states. But in California, the arrival of 165,000 international migrants more than offset this domestic outflow, so on the whole, migration resulted in 27,000 new Californians. In New York and Illinois, however, new residents arriving from international destinations were not enough turn their overall migration fortunes positive.
Minnesotans ended a 15-year net negative streak. Did word finally get out about our delicious hotdish? Minnesota has not seen positive domestic net migration since the early 2000s. This has led to much hand-wringing by policy and business leaders, but also strategizing, marketing, and savvy proselytizing about the virtues of this state where the APM Research Lab is located. Nearly 8,000 more residents arrived in Minnesota from other states than chose to leave in 2017. Similarly, Alabama (+3,800) and Kentucky (+1,000) saw a 2017 reversal that tipped their domestic tally positive, although the numbers are modest.
Meanwhile next door in North Dakota, domestic migration has shed more than 6,000 people in each of the last two years. Oil price weakness during some of this time period tamped down production and likely contributed to attracting fewer border-crossing workers than the inflow seen earlier this decade. During 2011-2015, North Dakota netted an average of 10,000 more new domestic arrivals annually, even approaching 16,000 domestic transplants in 2013.
Young people pack light and power domestic migration. Whether pursuing higher education, job opportunities, love, or just the amenities of their dreams, young adults crisscross the U.S. Among young adults age 18-24, more than 5 out of 100 hopped state lines in the latest year of data. Among 25- to 34-year-olds, the rate falls slightly to 4 out of every 100. No other age group comes close to this level of wanderlust. For all age groups 45 and older, the rate is 1.5 people in 100 or fewer.
While this is the national pattern, some retirement destination states see elevated rates of older adult in-migration. In Florida, during the latest year, 3 out of each 100 residents age 55-74 were busy unpacking their suitcase after arriving from another state. (But the more than 4 in 100 newly arrived 18- to 34-year-olds may have beat them to the beach.)
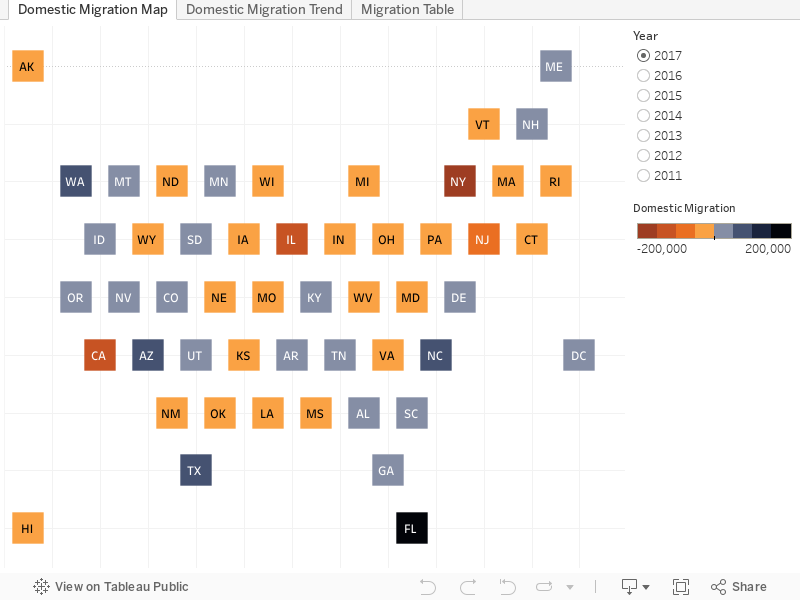
Explore all the domestic migration data from this decade in the dataviz below.
The map shows which states have the greatest domestic migration magnetism (in blue) and which states are more likely to be in the rearview mirror (in orange). In addition to domestic migration, hover or click on any state to see data on international migration and “natural change” (births-deaths). In future blogs, I’ll be exploring how these components also contribute to overall population growth or decline for states. Additional data views are in the tabs.
Domestic (state-to-state) migration each year of the decade
On mobile, view horizontally.
Source: U.S. Census Bureau, Vintage 2017 Population Estimates.
-Andi (@DataANDInfo)
This is the first article in a series about components of population change, based on the Census Bureau’s 2017 Population Estimates for states. Please also see the related articles on international migration and natural change.
Reactions? Please email us your thoughts or join the conversation on Twitter or Facebook.